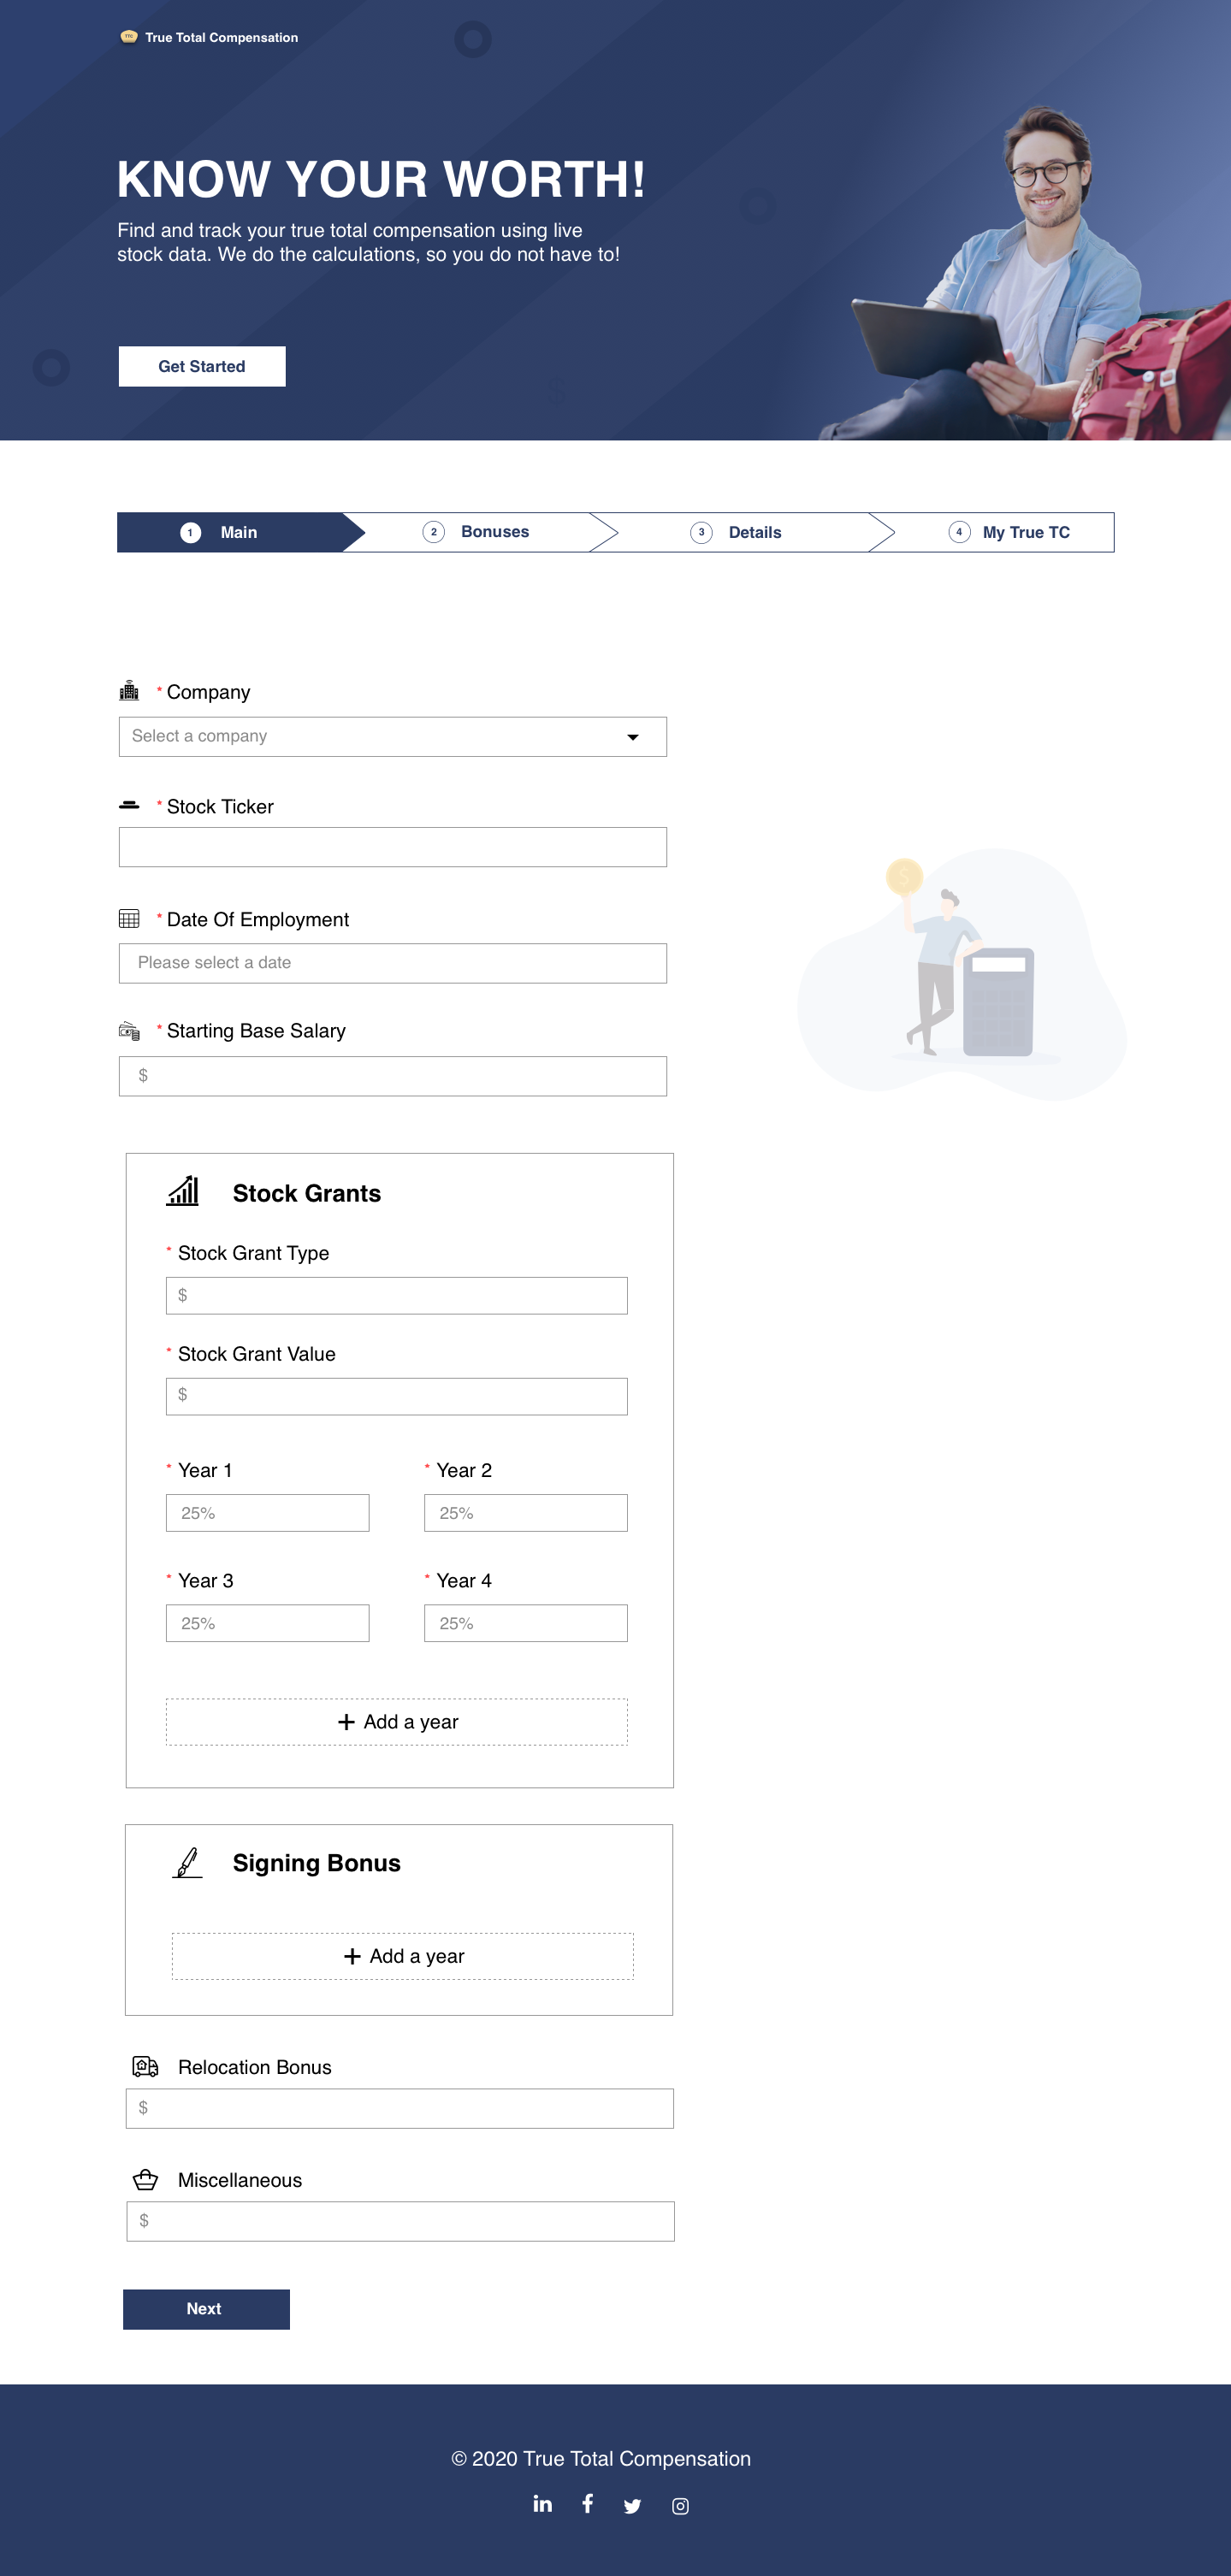
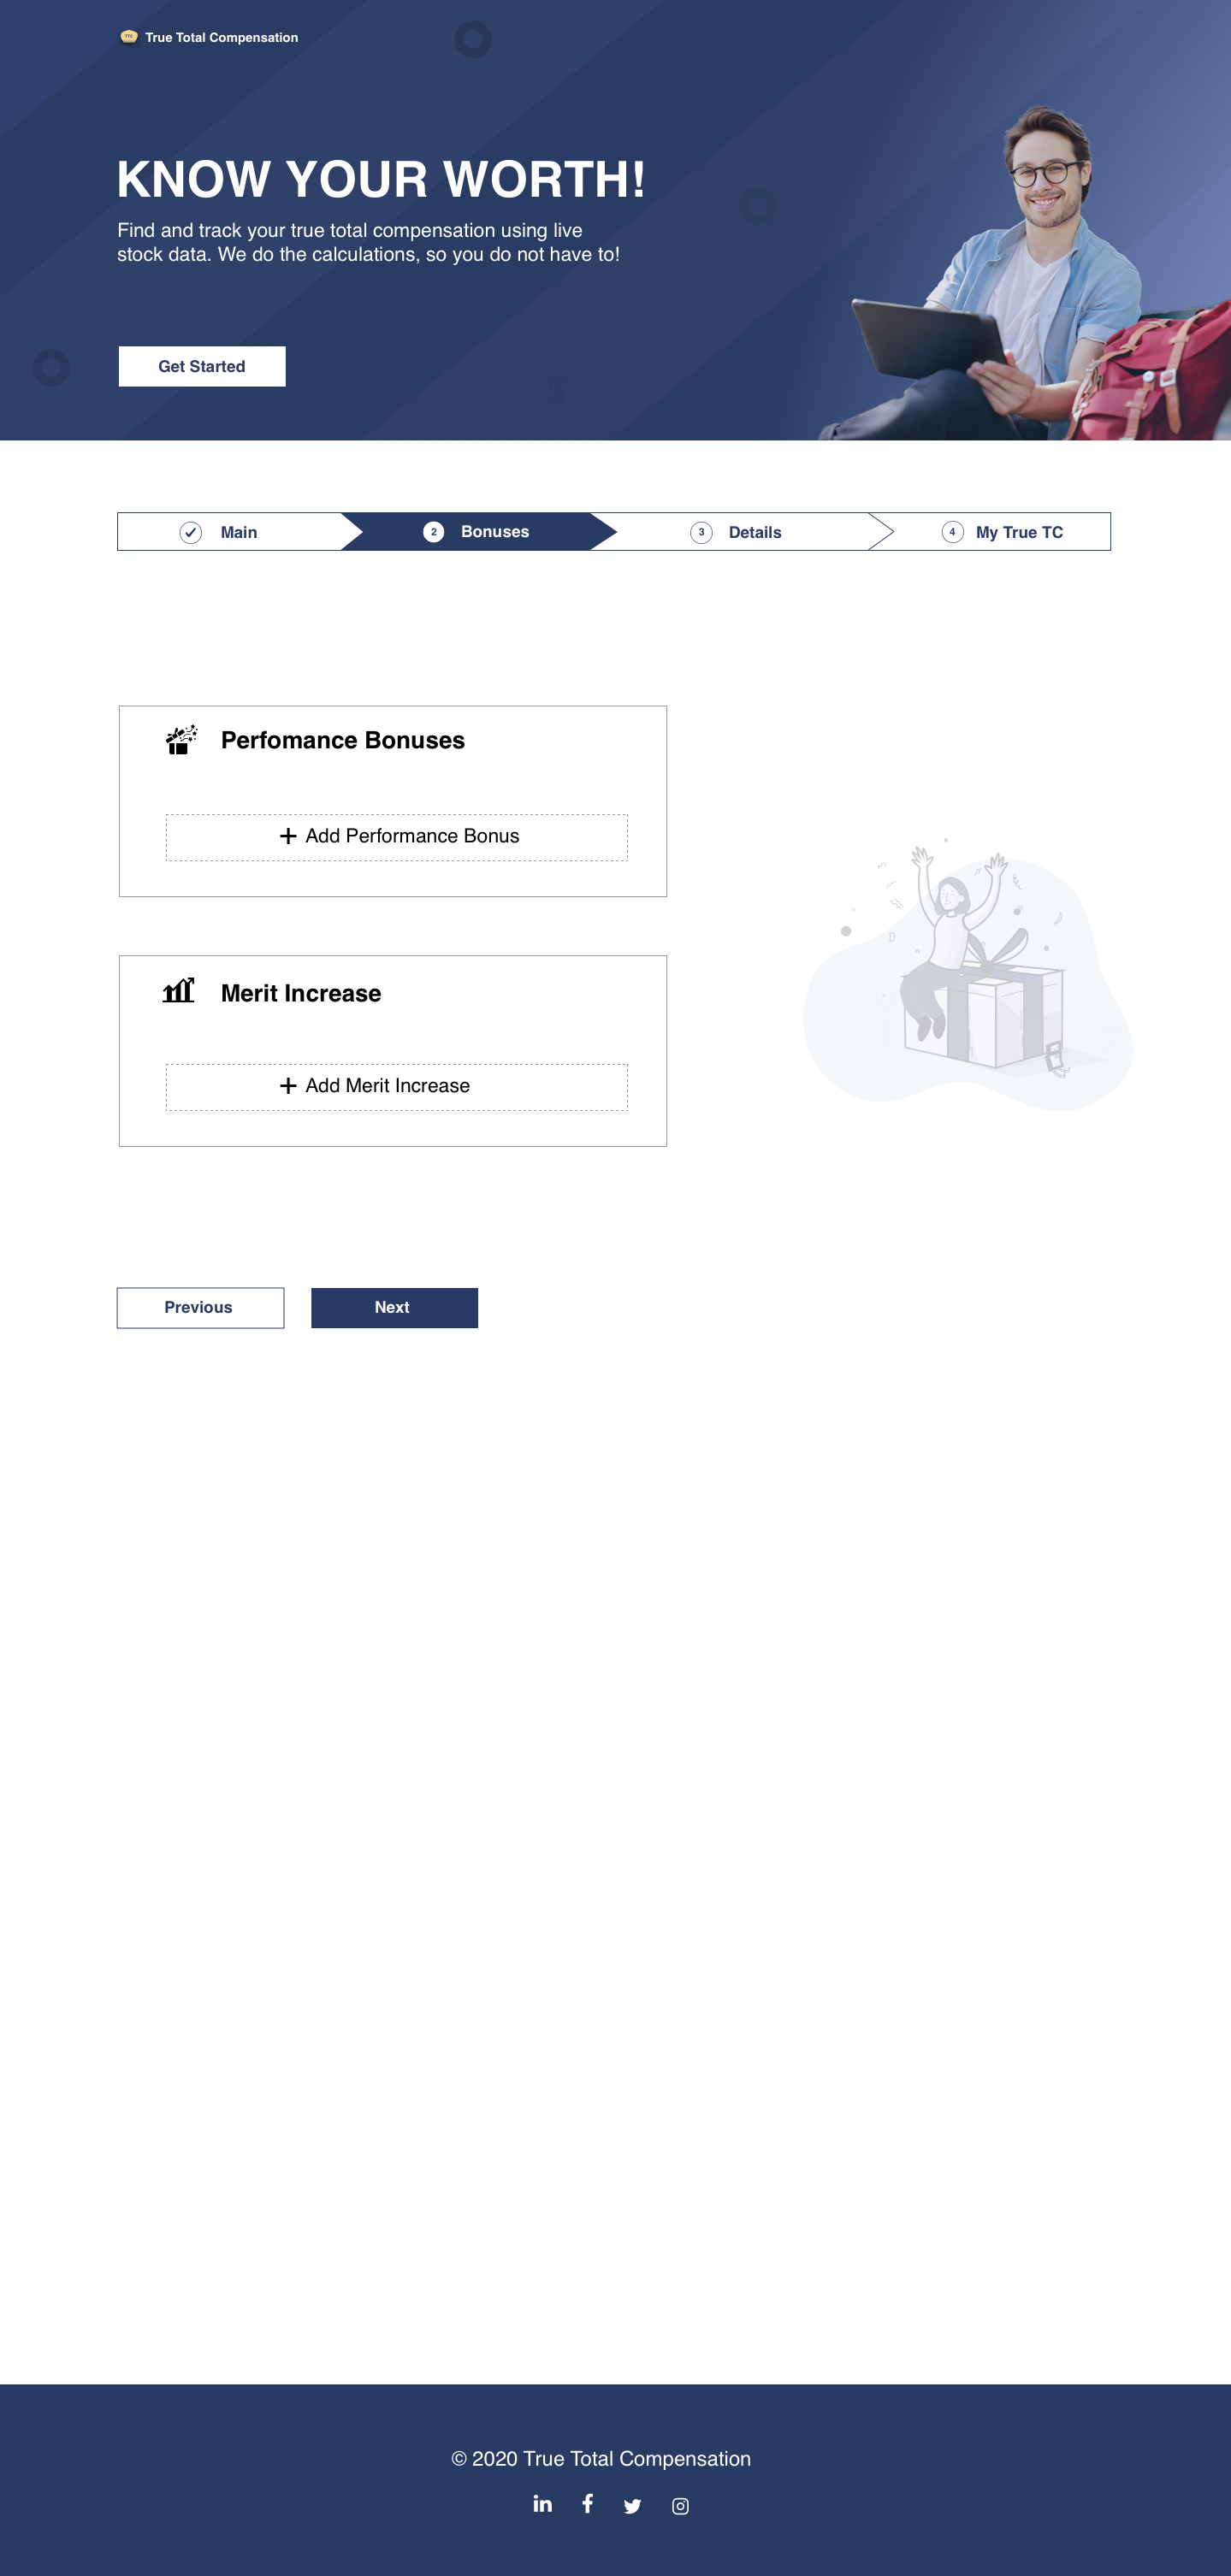
What company?
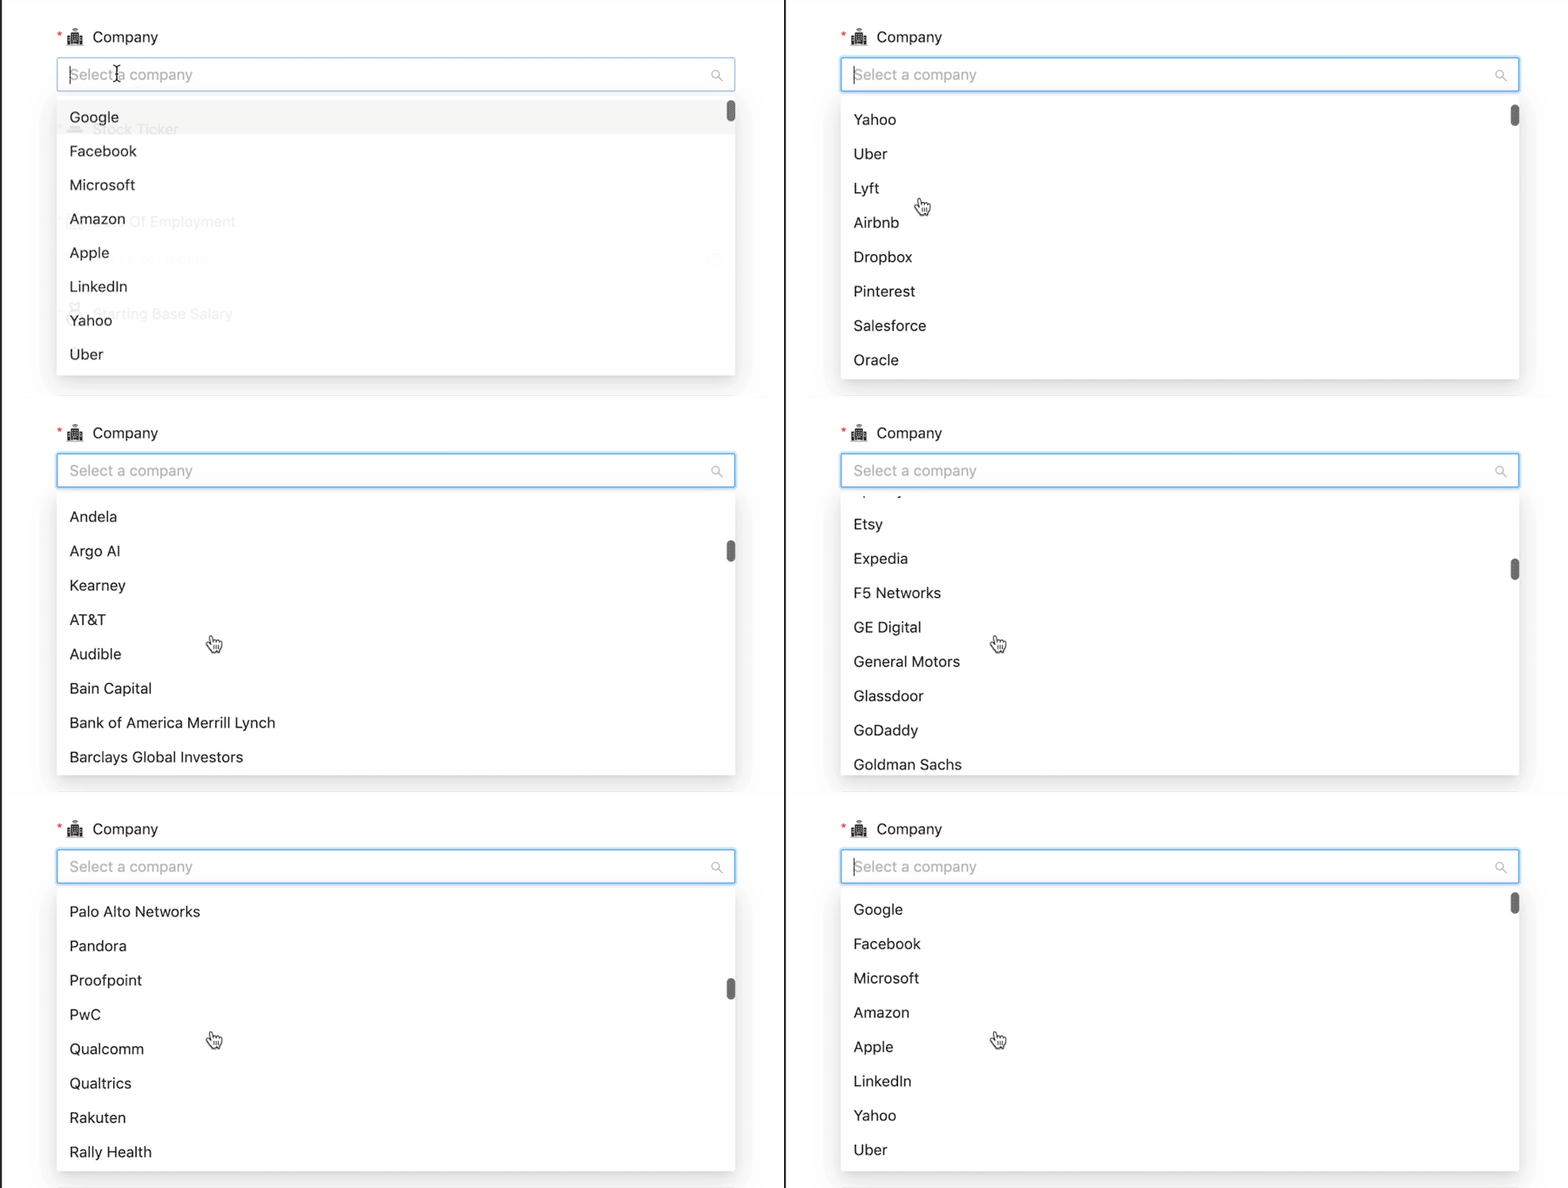
Starting with a drop-down feature containing 510 companies based on the most popular ones mentioned and discussed by our users in Blind app.
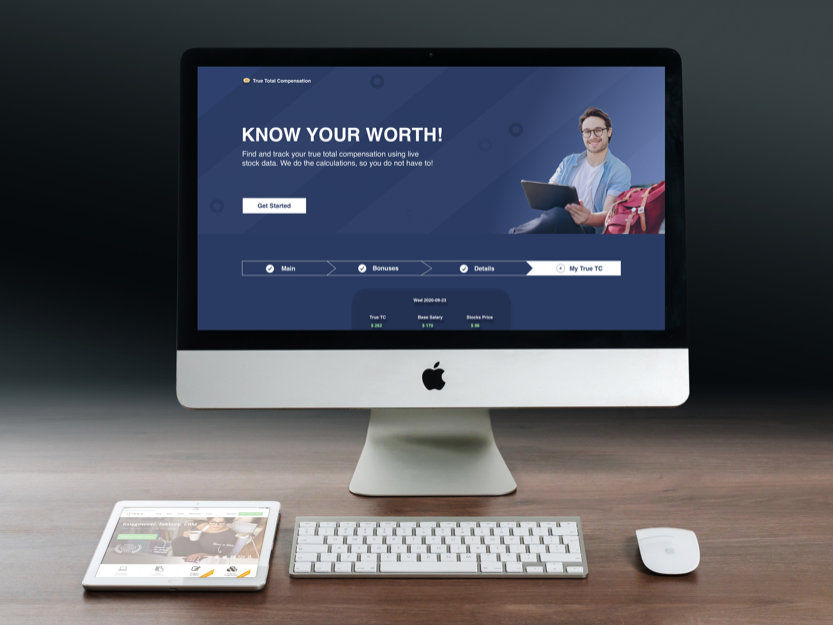
A live calculator for tech professionals to track their total compensation fluctuation based on the changes in the stock price.
UX researcher
UX/UI Designer
Responsive Website
Finance
4 pages
(Still Expanding)
Sketch, InVision,
Photoshop
14 days
Total project
There has been a general formula to calculate what engineers make. They use it to compare their
compensation with their peers in the field. The offer letter usually contains 4 main parts (not
including 401K match or free lunches):
• Base Salary
How much money will an employee be paid over the course of the year?
Usually, it gets divided by 24
or
26.
• Stocks
A grant or equity the company gives to the employee to align the interest of the employee with
the
interest of the company, so if the employee works well the company will do well!
The stock invests over a 4-year pattern with a 1-year cliff. The company waits for 1 year worth
of
stocks before they invest for you. After that, the rest of the stocks invests quarterly. Companies
also
add something called "Refresher grants" to further raise the employees' interest.
• Annual bonus
A lump sum payment made at the end of the year and it correlates to the performance of the
employee
themselves.
• Sign-on bonus
Not always considered part of the total compensation because it's a 1-time payment. Yet, some
other
companies use it as a massive part of the compensation. It's used as a recruiting tool to encourage
people to jump-ship from their old company to a new company.

Due to quarantine, my team and I were working from home.
We used Slack platform for collaboration,
Zoom for video conferencing, and
Trello to enable us to organize and prioritize
projects.
Reda was our PO. He
was responsible for ensuring the team follows the agile values
we are working with.
I conducted 8 iterations until we all
agreed on the final visual mockup below.
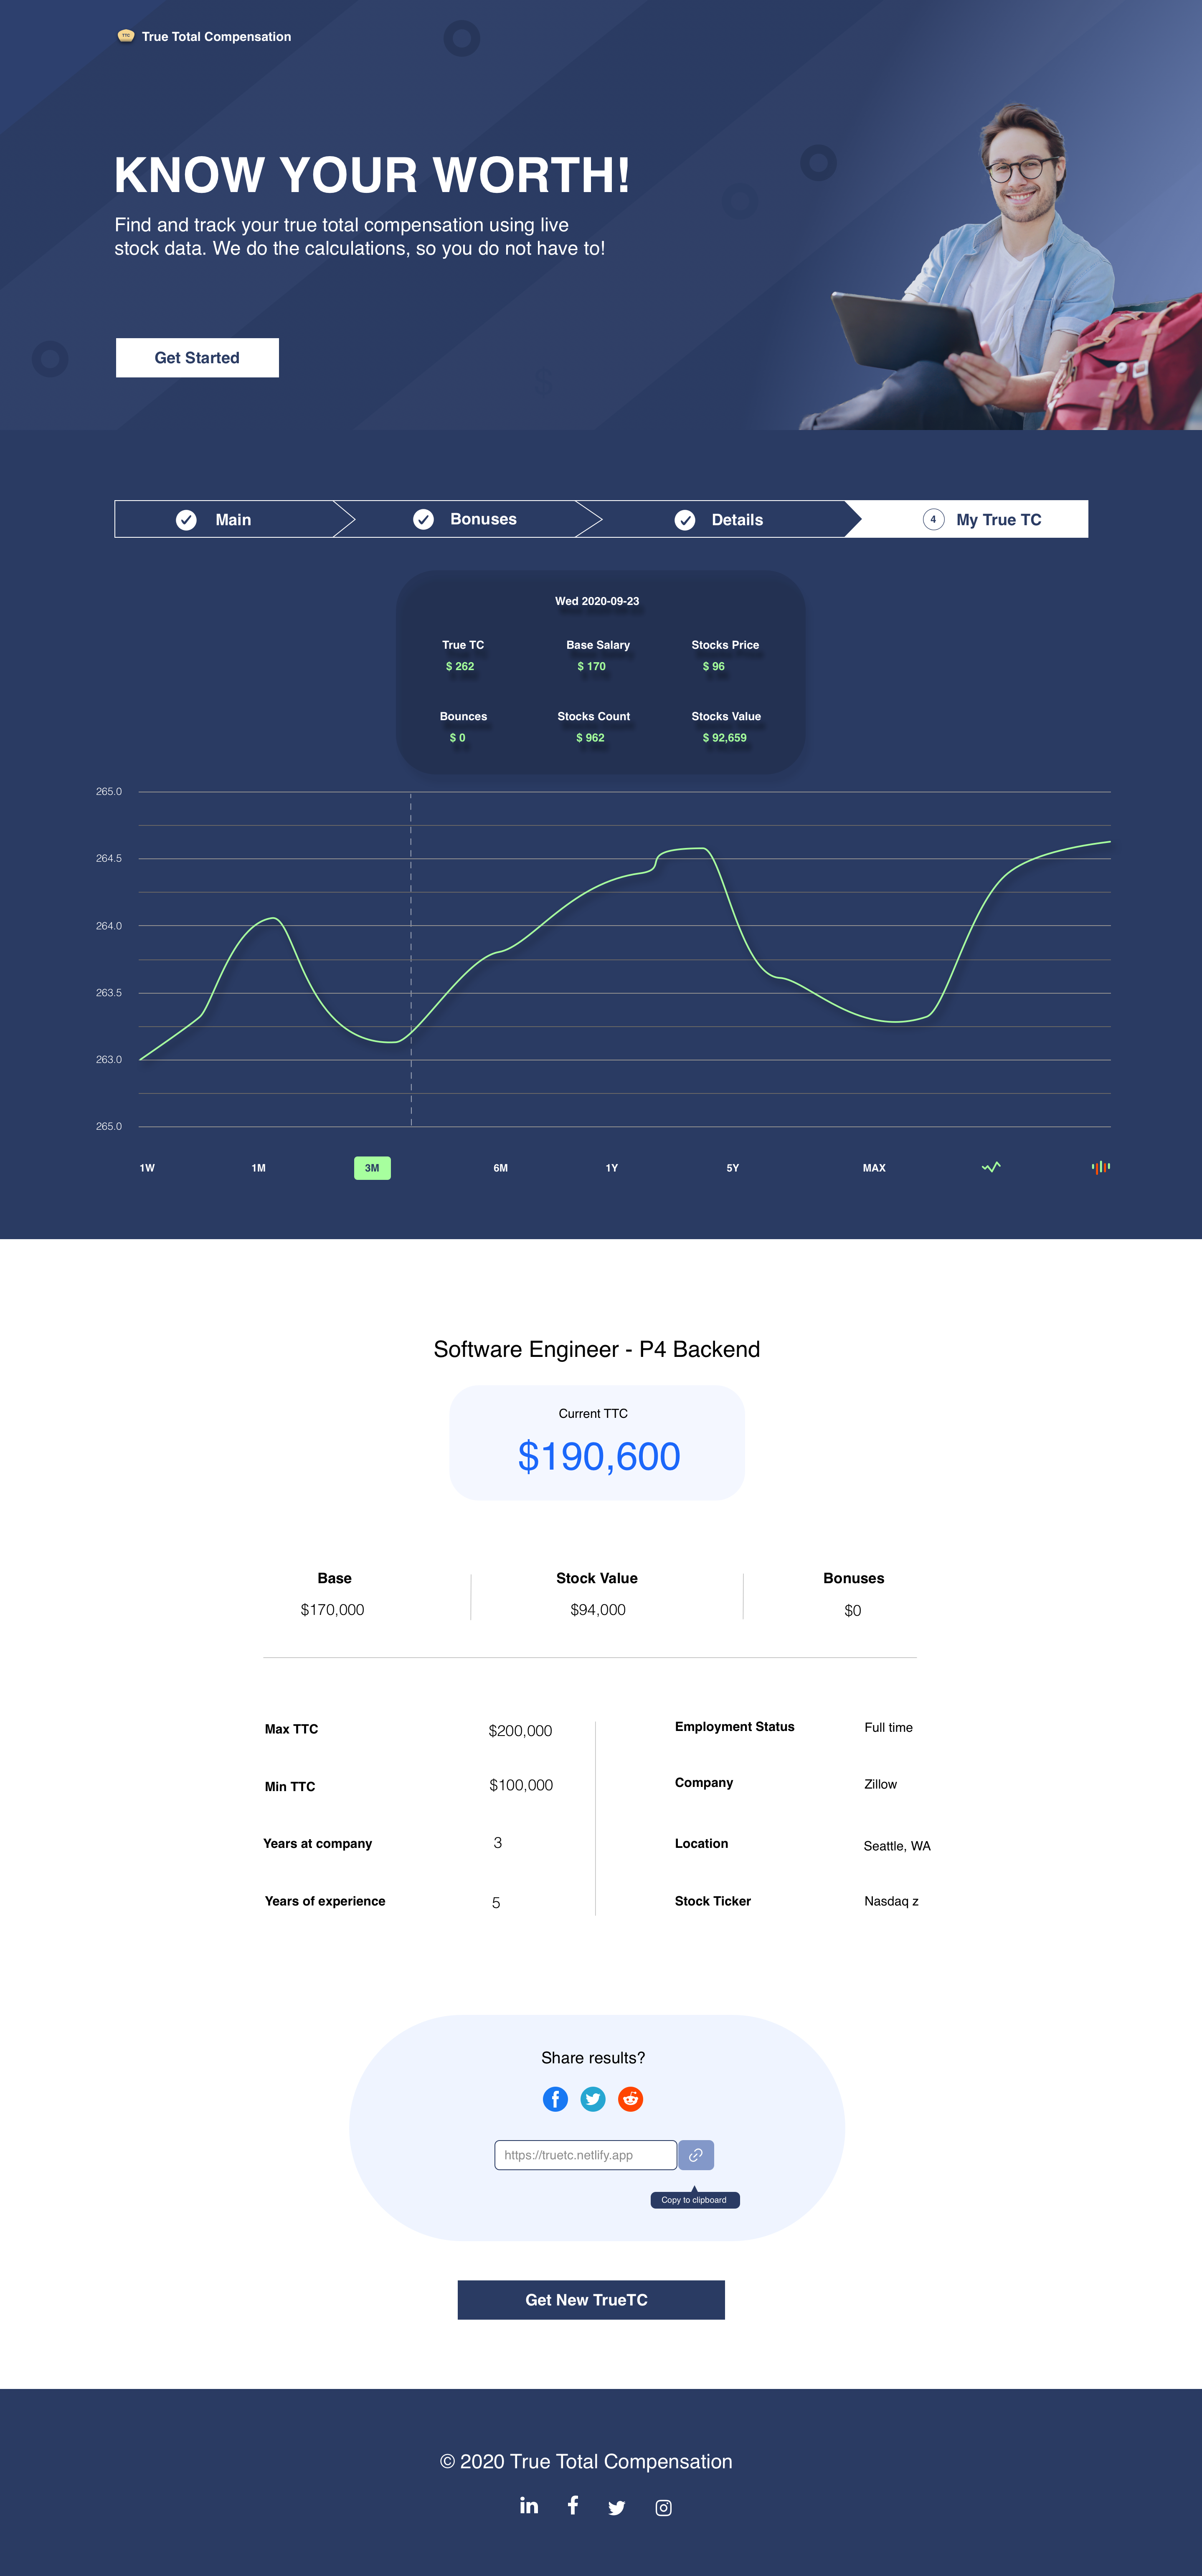
In the backend, there are tasks that run daily. Those tasks call a stock API and save the data into a database (dynamodb table). The API gets called as soon as the user inserts their information into the fields, and hits the "Submit button". We combine the data the user gives us with the data we get from the stocks API, calculate the TC for every day based on the new info, return an array that includes an object with a timestamp for the day and details for that particular day TC calculation. Since the returned data are a little complex, I designed a chart to help them visualize it in a more ascetical and comprehending way.
We all know, filling out forms online is the user's least favorite thing to do on a site, if it's
not
tedius. However, it's crucial to get accurate inputs because it impacts our final results.
Therefore,
I
added drop-down menus with multiple selections, so the user will get reassured that their
answers
are already
pre-existed and won't have to think too much before hitting the correct answer. It's also to
increase
the user completion rate and inhance engagement at a relatively low cost.
Starting with a drop-down feature containing 510 companies based on the most popular ones mentioned and discussed by our users in Blind app.
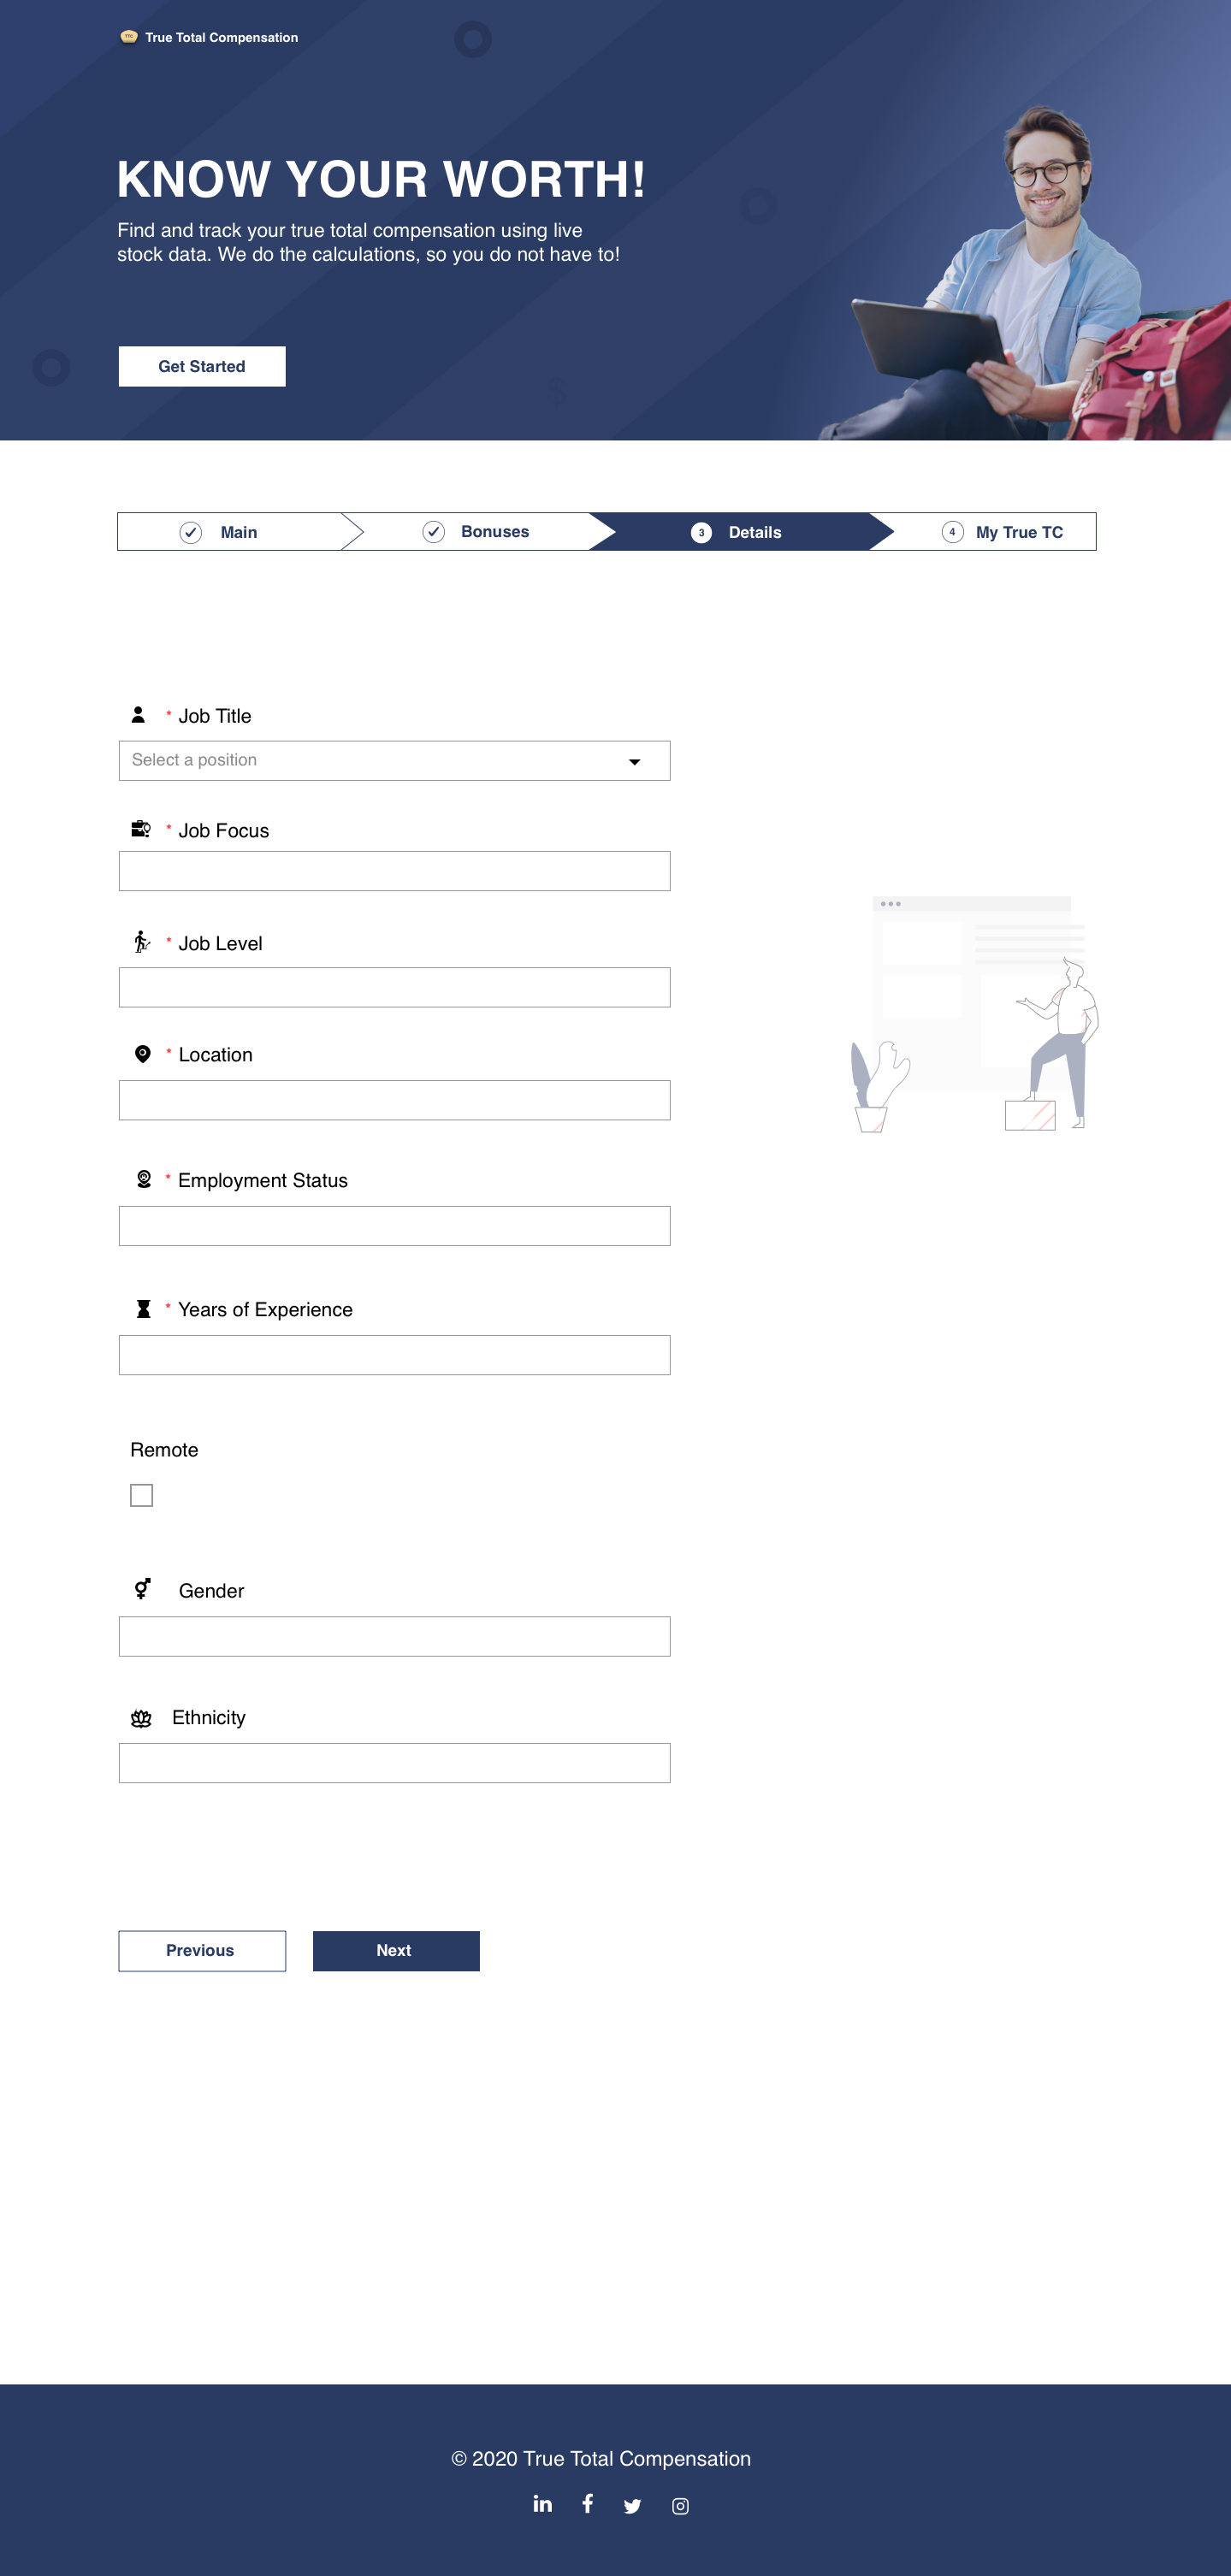
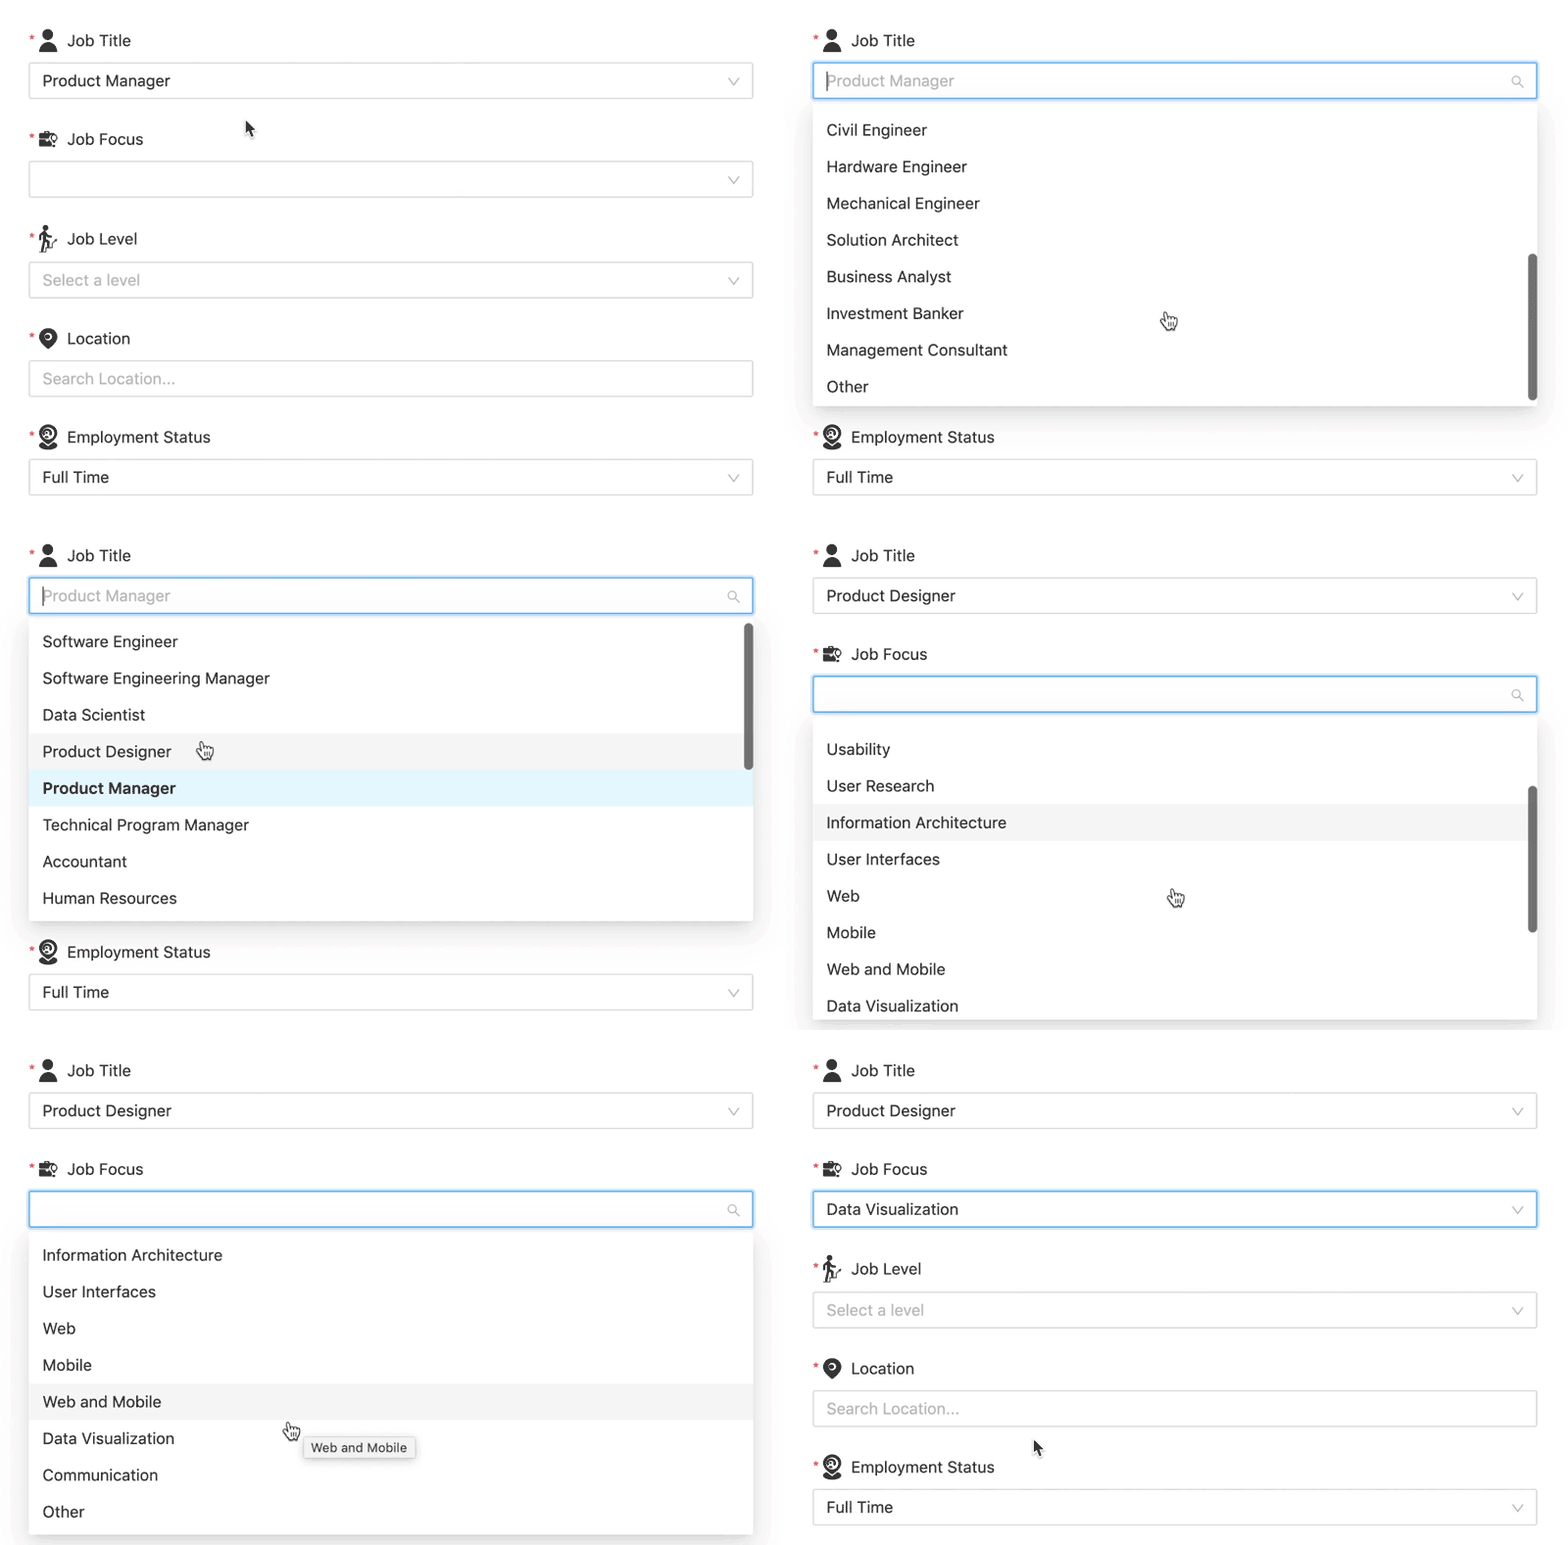
20 roles available to pick from, with various specialities. I added the Other selection to make sure we don't miss any type of user.
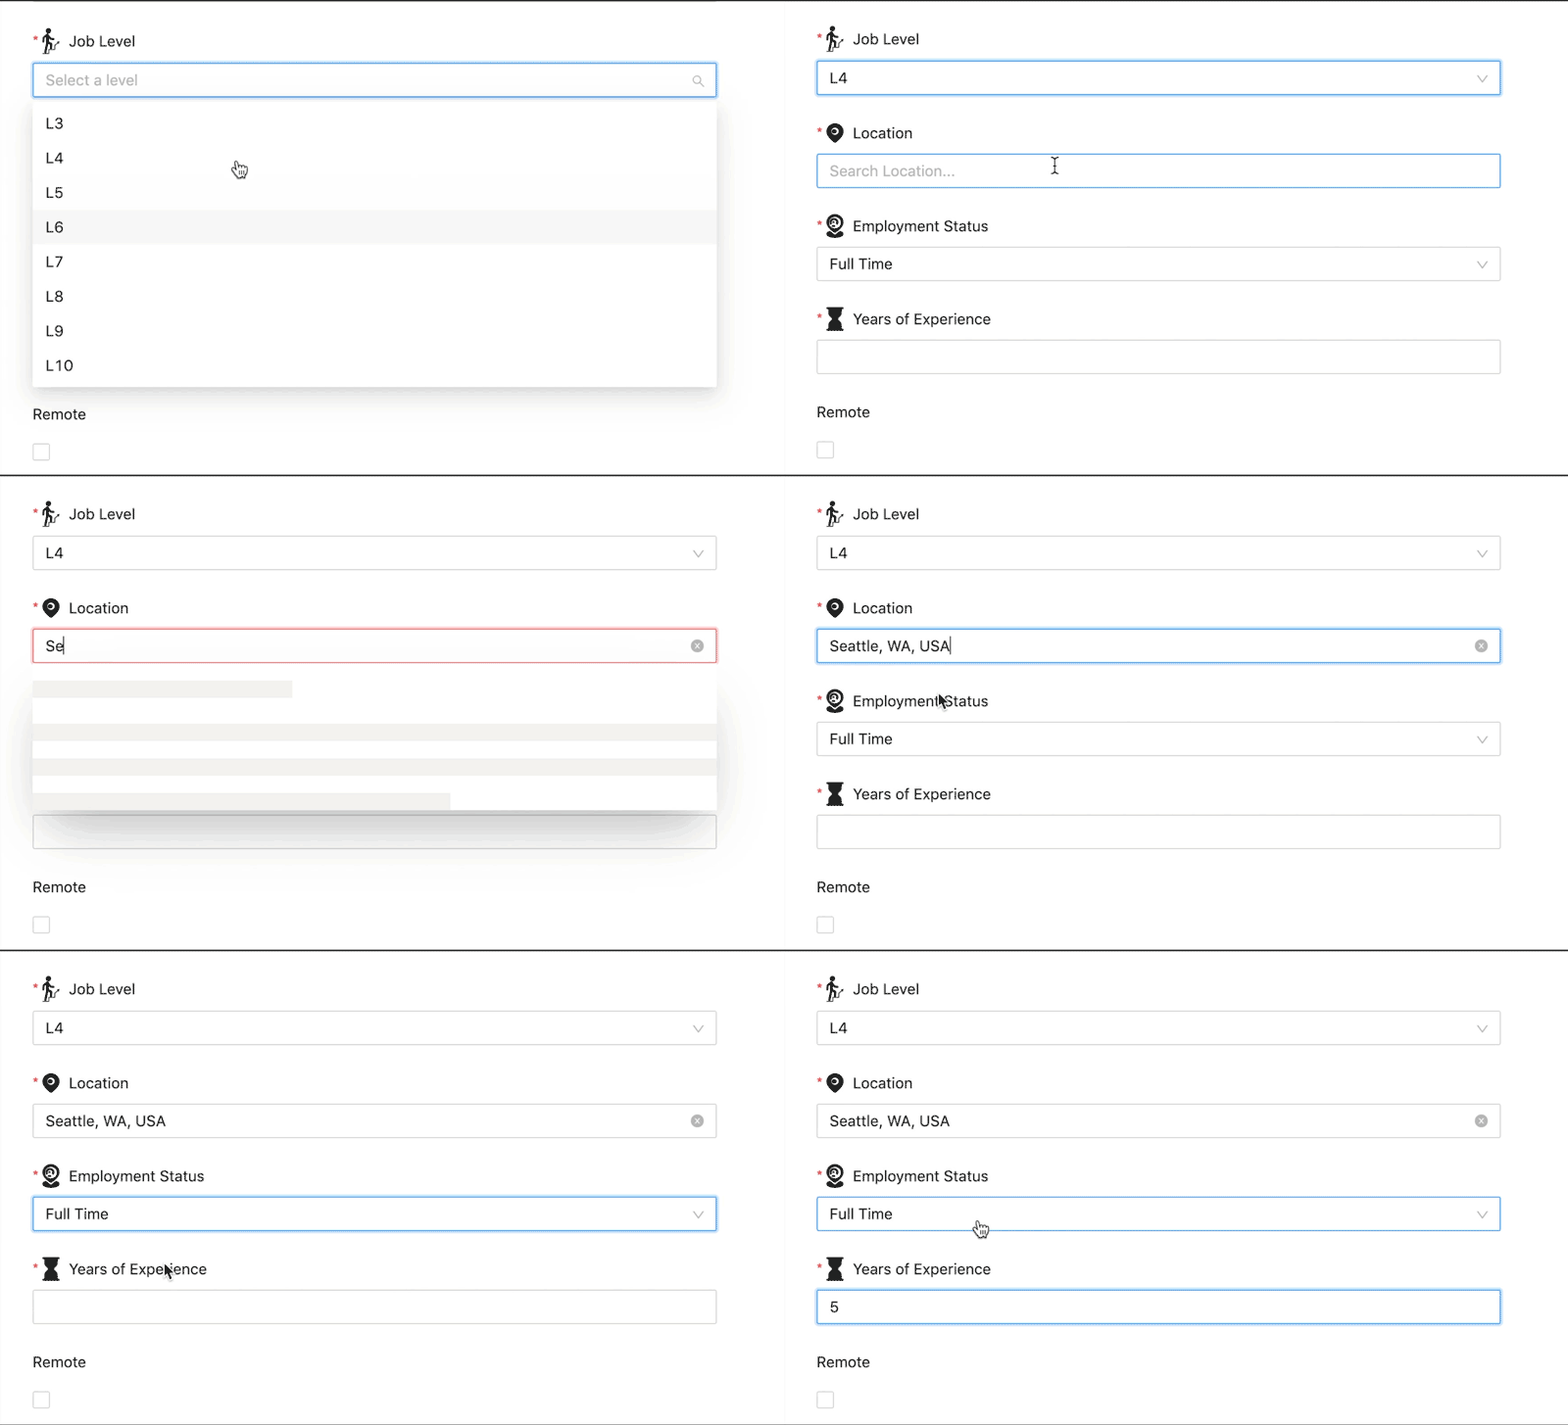
Seniority, location, status, and experience are all important factors that affect
total compensation.
10 levels to determine the seniority and salary band
each employee falls into, to
cover all levels from interns, up to executive roles with large scope.
I've added more than 2000 local and universal cities because our target audiance
are
international too.
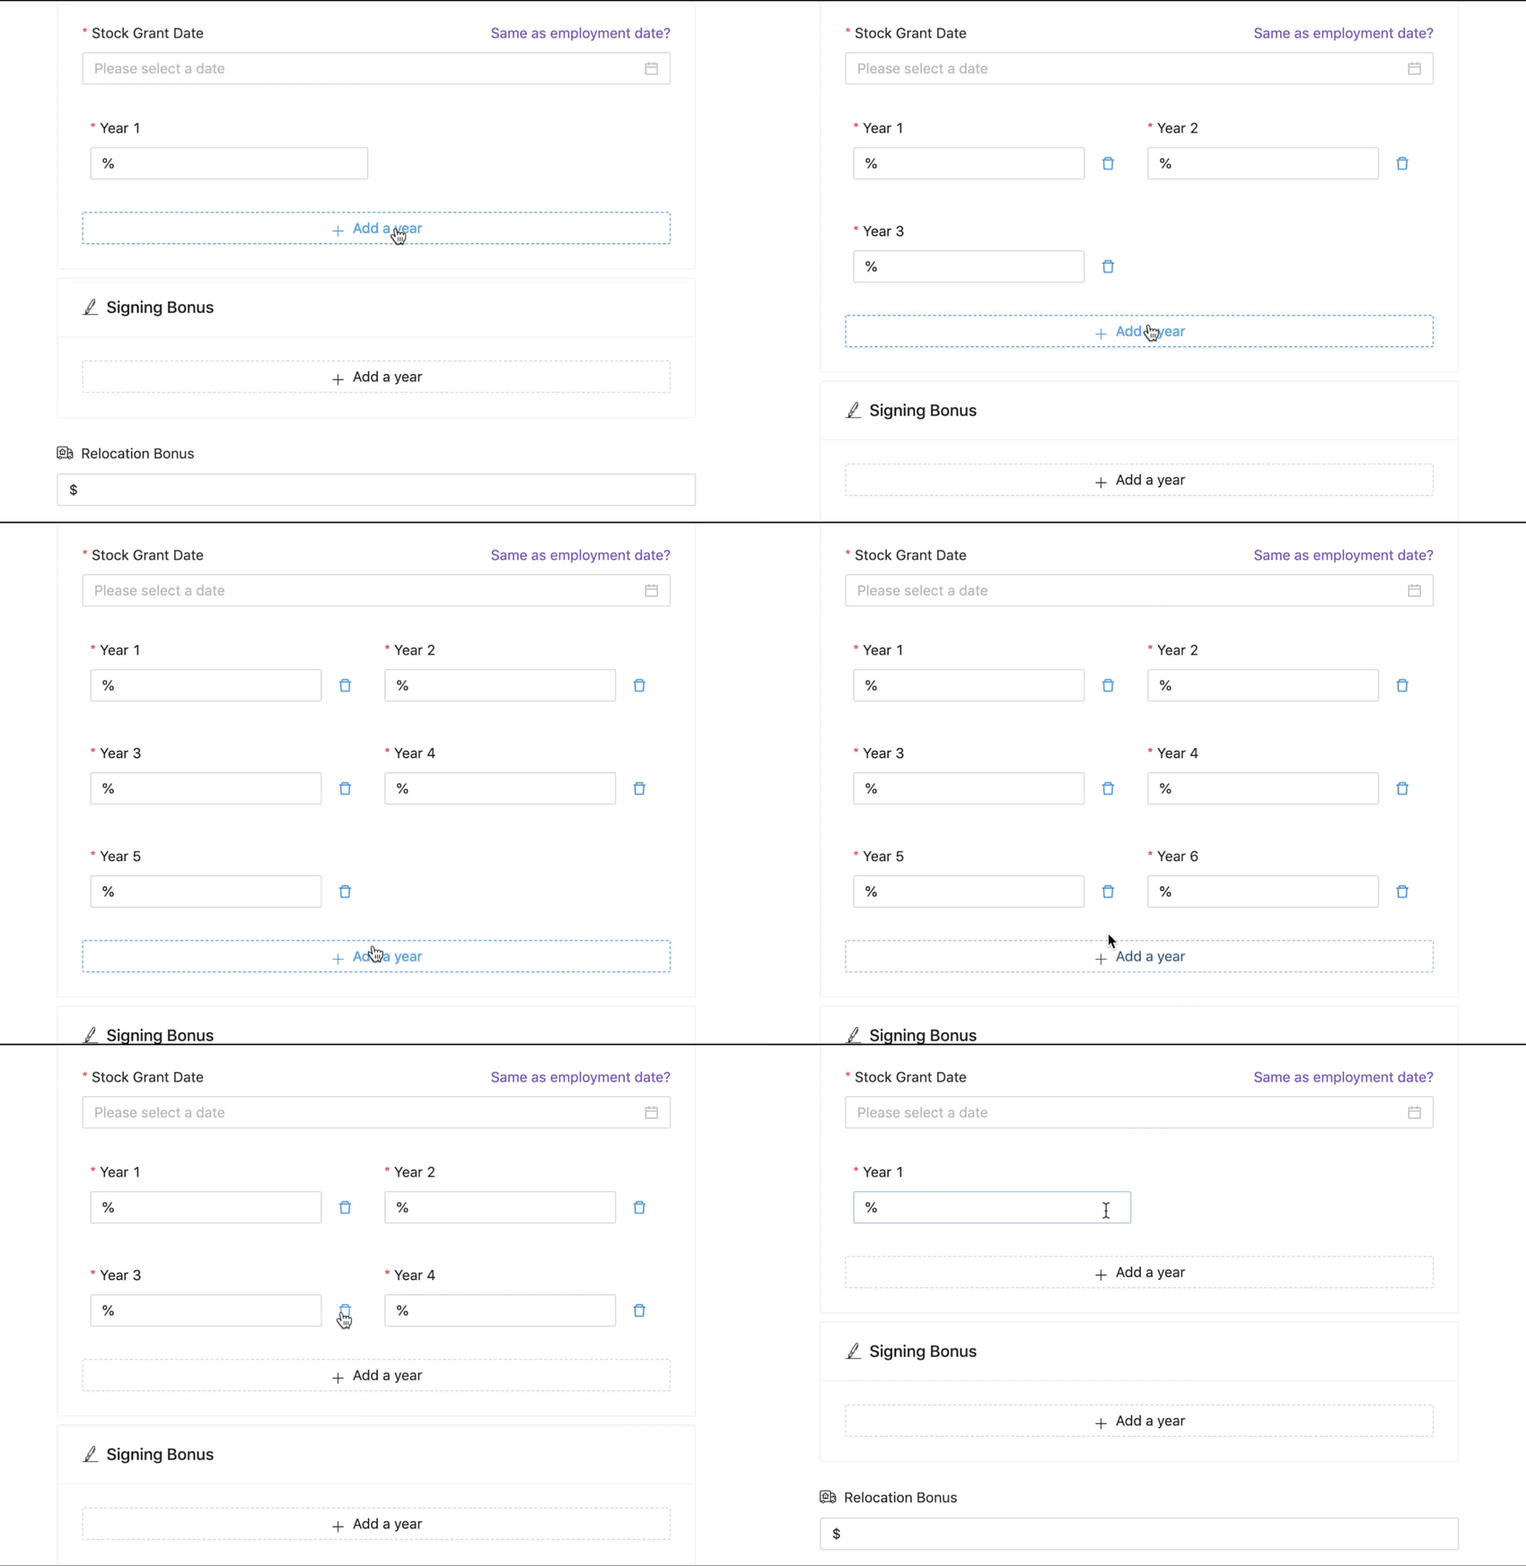
A user usually has a Multiple-year pattern with a 1-year cliff. The sum of the vesting schedules should be 100%. The company waits for 1 year worth of stocks before they invest for you. After that, the rest of the stocks invests quarterly.
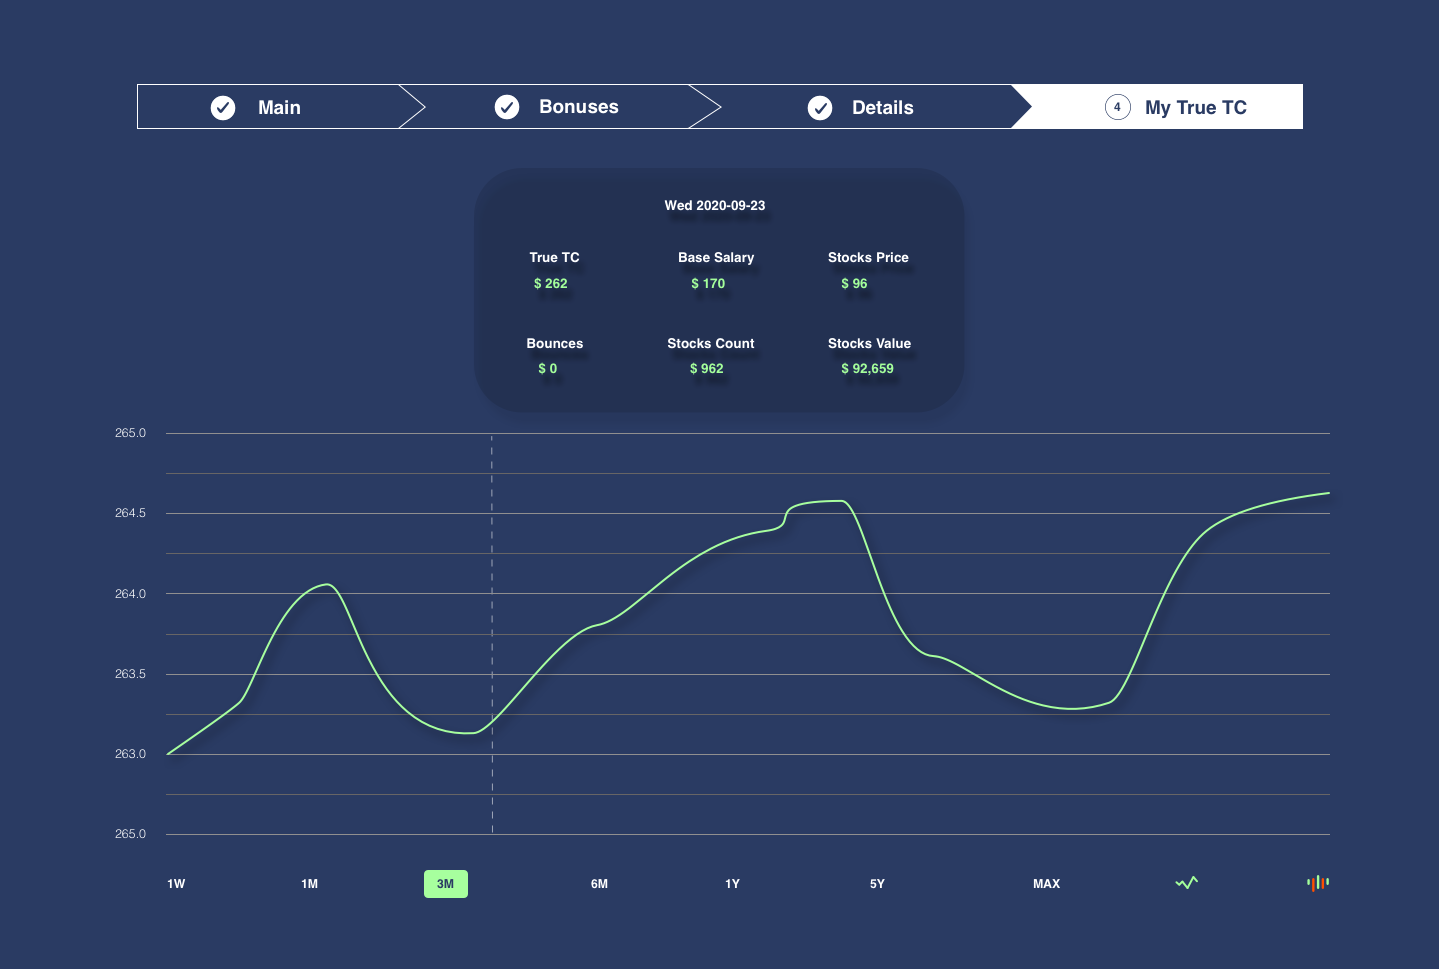
My suggested design demonstrating the dynamic TC.
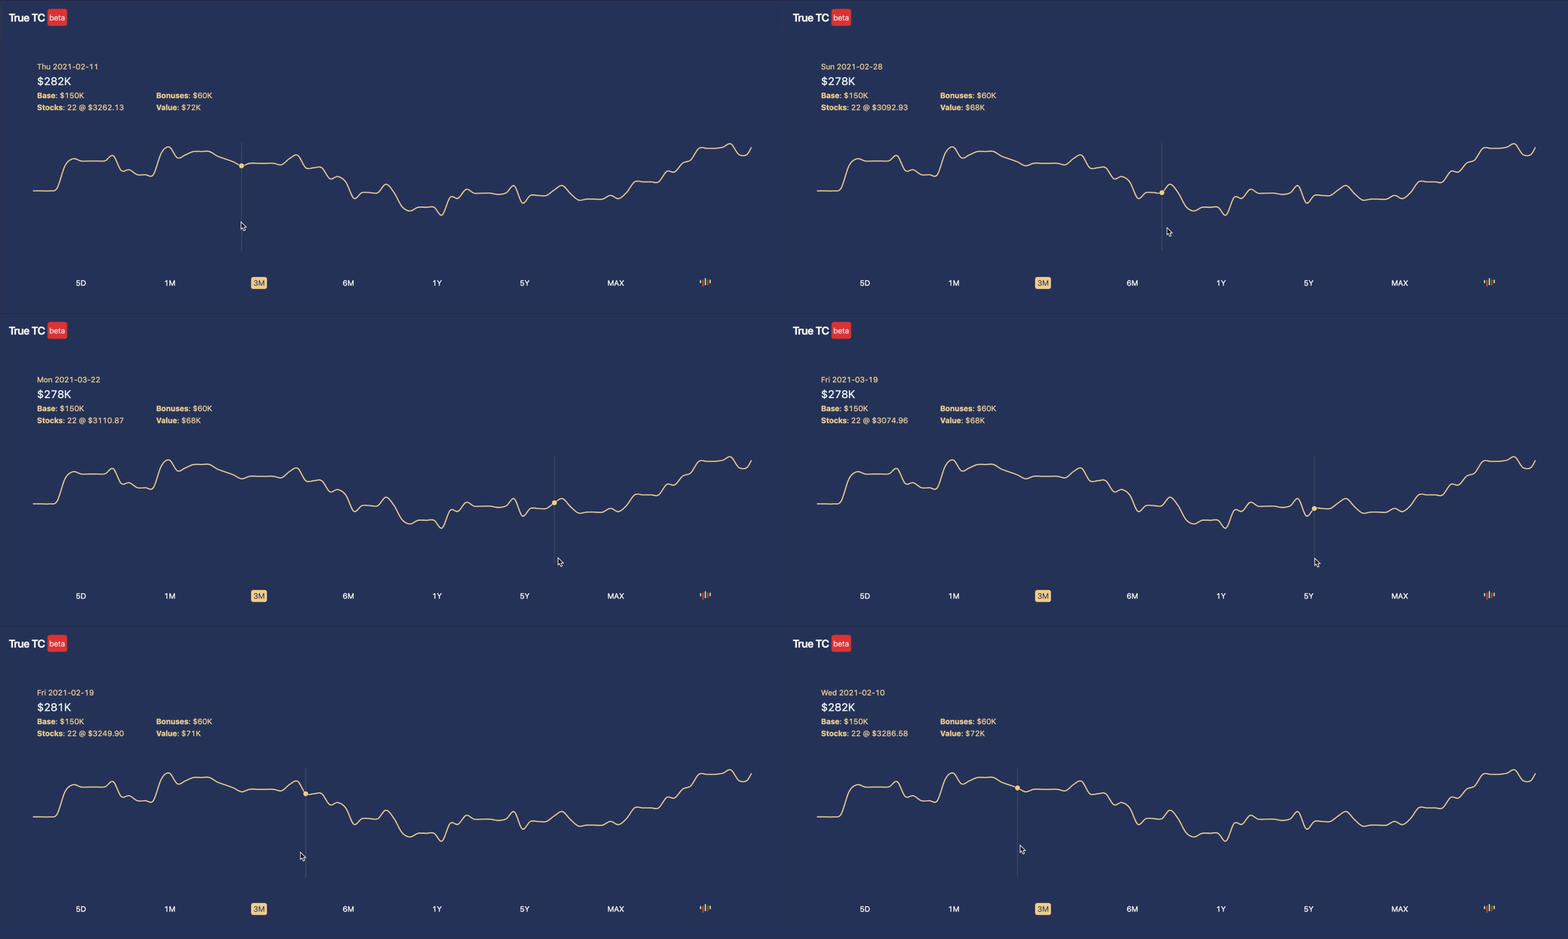
This is the implemented design. Developers couldn't implement the exact UI I presented above.
The
library
they were using
didn't
have enough flexibility, so that was the closest form to
it.
